(Note: I had every intention of getting this post out on “Tax Day”, which of course is not today…life got in the way, but I think it’s interesting enough to still post today…the “Day After”)
I was admittedly a little grumpy today. For a second year in a year in a row I owed “extra” federal income taxes. Of course I had figured this out sometime back in February, but today was the day that I was actually separated from my money. It wasn’t too much as a percentage of what I had paid overall (if it had been I would have owed a penalty of course), but it was still enough to make make me grumpy that I no longer had it.
In between my bouts of yelling “get off my lawn” at imaginary kids, I did wonder a bit about what the money that I had been separated from was going to be used for? So I took a look at the national budget (that’s what everyone does when they have questions like this….right?). I started by trying to use primary sources, but quickly found that government websites are less than user friendly…so I let the great folks at Wikipedia give me the data in a form I could understand and do something with.
Since the 2014 budget is still just a projection, I looked at 2013 numbers – they are literally and figuratively “in the books”. In 2013 to US Government spent a total of 3.45 Trillion US Dollars. That would be $3,450,000,000,000.00. About a quarter of that was spent on health and human services (including medicare and medicaid), nearly as much on social security and then about 18% on defense. So my money was most likely being spent on healthcare for someone else, retirement for someone or missiles for someone else (at least for now they are for someone else…). I guess I shouldn’t be so grumpy since I’m going to have really good karma, what with being so generous and all.
Having answered my initial question, I started to wonder where the Federal government actually got a hold of that much money? The amount debited from my bank account last year on this date was less than 0.0000002% of that, so where did the rest come from?
As I have already mentioned I paid a majority of my tax bill throughout the year (based on the idea that the pain is less if equally distributed I supposed). If I factor in the total amount that was extracted from my income in 2012, I personally contributed less that 0.000002% (lopped a zero off) of the 2013 spending. What could I possible have to be grumpy about – its such a small contribution. Leaving the issue of my selfishness alone for a moment, I still wondered where the rest came from?
Of course I wasn’t the only one grumpy yesterday or a year before yesterday- I bet a lot of you were too. Altogether we paid in over 1.3 Trillion US Dollars in individual Income Taxes and another 947 Billion US Dollars in Social Security (which despite Al Gore’s calls for a Lock Box still just goes into the general fund every year) for a total of 2.26 Trillion US Dollars. Now we are getting somewhere – that accounts for more than 2/3rds (66%) of the overall expenditures. Getting closer for sure, but where does the rest come from?
Well there is corporate tax of course (which is just another way of taxing individuals – anything the business has to pay gets passed along to their customers of course) which was a little more than 273 Billion US Dollars in 2013. Throw that in and we have almost 74% of the bill covered. Then there are excise taxes and “other” income. What are excise taxes and who pays them? You guessed it: you and me. Every time we fill up our gas tank or buy a beer we pay excise tax. Other includes things like rent from various properties the US government owns. Together those totaled another 237 Billion US Dollars, which gets us almost, but not quite there.
Taken altogether individual income taxes, social security taxes, corporate taxes, excise taxes and “other” covers a little more than 80% of what the total expenditures. Where did the rest come from? The answer is the same place it comes from when you or I are a little short at the end of the month – it gets borrowed.
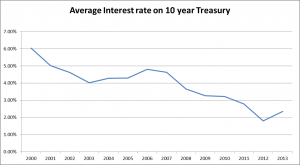
The Federal Government doesn’t have a VISA or MasterCard, so instead they sell bonds. At various times throughout 2012, the Treasury department issued bonds at an auction. The auction actually determines the interest rate at which the bonds are sold (rather than the of the price). Like bonds from corporations and municipalities, the interest rates on government bonds are an indication of risk. A low interest rate indicates a sure thing whereas a high interest rate includes a necessary risk premium. So what have the interest rates looked like over the last few years? Back to google which sent me over to treasury.gov (Wikipedia didn’t have an entry with the historical data that I could find):

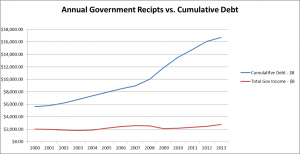
If low rate equals low risk, this data would indicate that the Federal Government has become a lower and lower risk over the last 15 years. I’ve never been to a fed auction so I can’t say exactly what factors that bond buyers have been using in their risk calculations. But I have been involved lending/borrowing transactions (always on one side of the equation) and there are typically three factors used to determine the risk of an individual borrower: income, debt and assets. The first two are pretty easy to find:

The red line shows the average total income per year from all the sources I listed above over the last 15 years. Two trillion a year is a pretty good income line, but its not growing all that much year over year. Not so much of a risk, but not a real positive either. The blue line is the cumulative debt, which is a clear negative risk indicator.
So of the two factors I could find easily, one is neutral and one is negative. That must mean that the one I couldn’t find easily, assets, must be a huge positive. National Parks are nice, but could they really overcome a 9 to 1 debt to income ratio? I think not. Maybe its all the military hardware we’ve accumulated since WWII? Based on the prices at the last surplus auction if this is what they are counting I don’t think that’s it either (of course there weren’t any Trident subs or Abrams tanks up for auction). The gold in Fort Knox? Even the most ardent support of the state doesn’t believe that’s there anymore.
My guess is it comes down to two things: the security of the income and the power of the (printing) press. The red line in the chart above shows that while the income isn’t growing all that much, it is a very secure income stream = it’s not going away…maybe there is some value in that military hardware after all. Then there’s the printing press (I know its just a computer entry)…that has to loom large in most risk calculations.
To summarize, your three way for tax day is this:
- I think we have a pretty good idea (black budget projects excepted) how much they are spending and what they’re spending it on.
- We have an even better idea of where they are getting it from – taxes, taxes and borrowing.
- The question I don’t have a solid answer for is why can they keep borrowing to make up the difference, especially at such low rates when all easily discoverable indicators would put them in the high risk category? Having a solid answer to this question would lead to some pretty interesting next questions.
Leave a Reply